

Aug 10, 2026
Market Roundup
-
Equities pulled back modestly as the hawkish Fed offset geopolitical relief. The S&P 500 ended June slightly negative, while the NASDAQ retreated on late-month tech weakness. Small caps and emerging markets continued to lead year-to-date showing expanding market breadth.
-
A U.S.–Iran peace framework sent oil prices to pre-war levels after the U.S. and Iran announced a preliminary agreement to reopen the Strait of Hormuz and end hostilities. Brent crude fell below $78/barrel, erasing the bulk of war-driven energy inflation.
-
The Fed flipped hawkish at Chair Warsh’s first meeting holding rates at 3.50–3.75%, with 9 of 18 officials now forecasting a rate hike by year-end, and 17 of 18 see inflation risks skewed to the upside. The Fed raised its 2026 PCE forecast to 3.6% and removed prior easing-bias language.
-
SpaceX completed the largest IPO in history marking the first of several expected high profile AI related IPOs this year. Shares spiked in the initial days after the IPO pushing SpaceX’s market cap briefly above $2 trillion before a retreat caused by a late-month AI spending driven selloff in the tech sector.
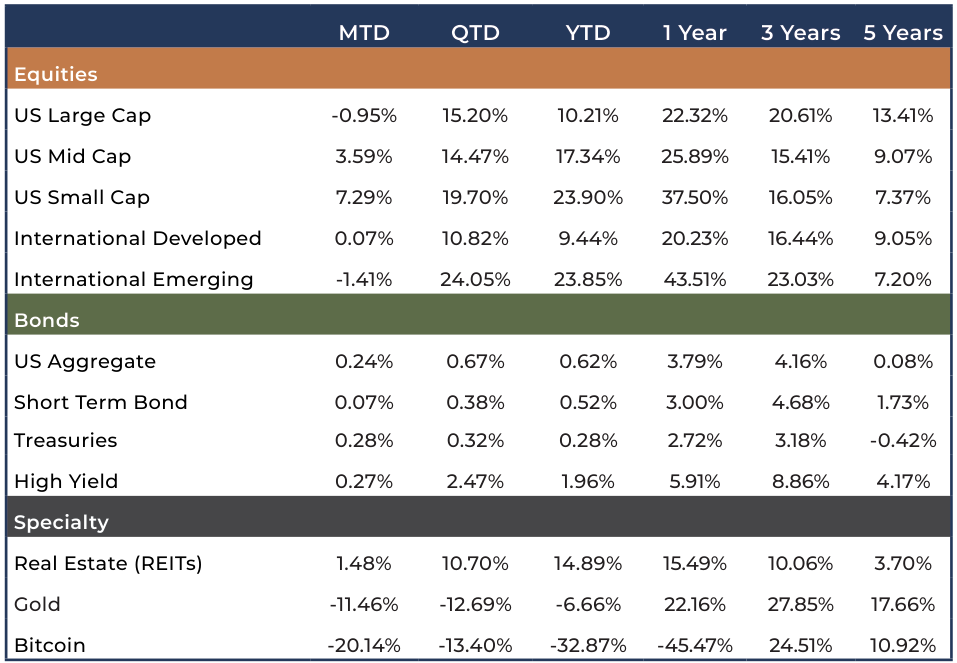
Source: Bloomberg, L.P.
Positioning & Outlook
- The Iran peace deal remains fragile with the agreement signed in June serving as a framework and not a final treaty. While a sustained reopening of the Strait of Hormuz may lower oil prices, it will still take a while for inflation to shift materially lower. We expect volatility during ongoing negotiations as both sides seek a permanent solution.
- A rate hike is now the market’s base case. Chair Warsh established hawkish credibility at his debut meeting, and fixed income volatility is likely to persist. We continue to favor shorter term, higher quality over long-duration Treasuries.
- The SpaceX IPO and the late-June tech selloff signal that markets are shifting from rewarding AI infrastructure spending to demanding proof of returns. We continue to favor companies with real, growing AI revenue over those still in the build phase.
- Diversification continues to be rewarded. Small caps, international equities, and real assets have all outperformed large-cap U.S. growth year-to-date. If oil normalization persists and inflation cools, this broadening trend has room to run. We continue to see merit in exposure to private markets and commodities as core complements heading into H2 2026.
Disclosures
Important Information
Advisory services are provided by Bison Wealth, LLC (“Bison”) an investment adviser registered with the SEC. Registration does not imply a certain level of skill or training. The information contained herein is for informational purposes only, is believed to be reliable, has not been independently verified and is based on the opinions of Bison and subject to change at any time without notice. Nothing herein should be deemed an offer or solicitation to buy or sell a security or to provide investment advice. All investments contain risks to include the total loss of invested amounts. Past performance is not indicative of future results. Diversification does not protect against losses.
Index Disclosure
An index typically measures the performance of a basket of securities intended to replicate a certain area of the market, asset class or geopolitical region among others. Indices do not represent investments in actual accounts. Investors cannot invest directly in an index. The asset classes noted here reflect the following indices: “U.S. Large Cap” represented by the S&P 500 Index. “US Mid Cap “represented by the S&P 400 Index “U.S. Small Cap” represented by the S&P 600 Index. “International” represented by the MSCI Europe, Australasia, Far East (EAFE) Net Return Index. “Emerging” represented by the MSCI Emerging Markets Net Return Index. “U.S. Aggregate” represented by the Bloomberg U.S. Aggregate Bond Index. “Treasuries” represented by the Bloomberg U.S. Treasury Bond Index. “Short Term Bond” represented by the Bloomberg 1-5 year gov/ credit Index. “U.S. High Yield” represented by the Bloomberg U.S. Corporate High Yield Index. “Real Estate” represented by the Dow Jones REIT Index. “Gold” represented by the LBMA Gold Price Index. “Bitcoin” represented by the Bitcoin Galaxy Index.