

Jan 10, 2024
Q4 2023 Market roundup
Key Observations and Outlook
- Stocks maintained the positive momentum from November to finish the year near all-time highs. The broader market picked up momentum and strength as everything non-mega cap rallied into the end of the year, with small caps leading the way.
- The S&P 500 Index finished the month with a return of +4.5% and the year +26.3%, while small caps were up 12.8% for the month and +16.1% for the year.
- The 10-year treasury yield reversed an upward trajectory in November and continued falling into the end of the year, finishing at 3.87%, nearly the exact same as where it started the year.
- Bonds were up almost as much as stocks in December with the Aggregate bond index up +3.8%, fueled by the Fed’s signaling an end to the rate hiking cycle.
- The Fed has guided to lower rates in the coming months, however, the market is pricing in more than the Fed has guided, potentially leading to some market volatility in the short-term.
- While recessionary fears have subsided, a mild recession is still a possibility despite the claims of a soft landing and the market exuberance to end the year.
- Diversification across a broader spectrum of companies not represented in the Mega-Caps should provide better relative performance to stock portfolios in 2024.

Stock Market Recap
2023 can be summed up with the old adage that the market will usually do what it needs to prove the majority wrong. Coming into the year, bearish consensus views on the market were entrenched in the minds of investors. Low and behold, the S&P 500 finishes December and the year with returns of 4.5% and 26.3%, respectively.
In our commentary for the end of October, we referenced the overly bearish sentiment and oversold market conditions that left the market ripe for a year-end rally, and what a rally it was. From the lows at the end of October, large caps were up 16%, but small caps were up an impressive 24%, reflecting a broadening of the market rally to end the year. The breadth and momentum of this rally is evident from the fact that the percentage of stocks above their 50-day moving averages rose above 90% by the end of December, signifying improved and broad participation across the multiple indices compared to earlier in the year. The table below demonstrates the 20 instances of this occurrence since 1970, with the last column reflecting an average return of 18.5% one year later, with the market higher 20 out of 20 times.

Currently, this rally has left the market overbought on a short-term basis with shorter-term sentiment indicators reflecting excessive optimism, the exact opposite from two months earlier. Given this backdrop, increased volatility and market pullbacks should be expected to start the year.
Bond Yields Reverse Course as Fed Signals End to Rate Hiking Cycle
Bond yields were quite volatile through the course of the year, with the 10-year treasury yield trading as low as 3.30% and as high as 5.00%. From point to point, the 10 year yield somehow finished 2023 right where it started the year at 3.88%. In between those points, there was quite a bit of movement, causing bond returns to fluctuate during the period. However, a strong finish to the year saw the Aggregate bond index finish 2023 with a +5.53% return.
Bond market volatility was fueled by the 3-way tug-of-war between inflation expectations, the economy, and the Fed. Investors weighed the evidence on these factors during the course of the year in trying to assess when the Fed might capitulate on the rate-hiking cycle. Rates ramped through the 3rd quarter as the economy accelerated, but inflation continued to moderate, ultimately leading the Fed to talk about future Fed rate cuts in 2024, as opposed to further rate increases.

Recessionary Fears Subside, but the R-word Still a Possibility
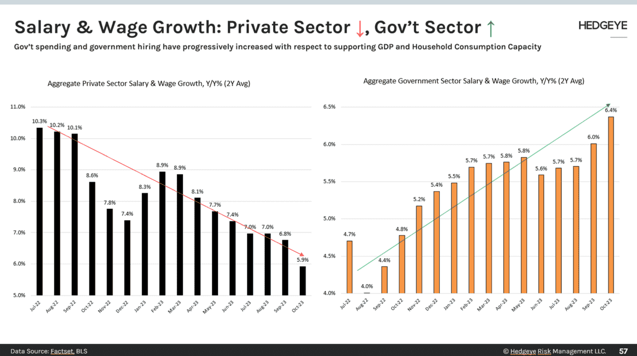
Given the greater than expected economic growth experienced through the 3rd quarter of 2023, fears of a recession have faded and claims of a soft landing are reverberating across Wall Street and the financial news headlines. However, several key factors that helped to sustain the economy during 2023 may not be as much of a tailwind in 2024. Government spending was one of the most significant contributors even though much of the fiscal stimuli may have been unintentional, including non-discretionary items like entitlement spending and social security spending, up over a combined $400 billion, mostly due to an 8.8% cost of living adjustment. Consumer headwinds include the inception of student loan repayments in October, the fact that consumers have already ramped up credit card debt significantly, and credit card delinquency rates that are hitting new 10-year highs.
Interesting how government wage growth seems to be propping up total wage growth.
Perhaps the economic pundits that were so wrong about economic growth in 2023 might be jumping the gun on a soft landing for 2024. We feel near certain that growth slowed in Q4 and that it will continue to slow in Q1 and Q2 of 2024, so the question on investor’s minds is whether we will see just a slowdown in activity or a mild recession. Based upon some of the headwinds mentioned, we believe that a mild recession in the first half of 2023 is a possibility, but lower than a 50% chance.
Other Key Economic Gauges
Low rates of unemployment have been a positive factor helping to sustain the economy during 2023. However, the job market has loosened during the course of the year, which has had an effect of lowering wage growth, a positive contributor to the moderating inflation story. We are keeping a watchful eye on the drivers of the jobless rate. Counterintuitively, there is a more heightened risk of recession when you are at full employment and begin to see softening. With that in mind, take note of the just released ISM Services Employment report released the first week of January, which dipped well below 50 indicating a decline in employment in the services economy. The last time we witnessed such a decline in this data was in early 2020.

The Leading Economic Index (LEI) declined again in November and has remained in contractionary territory for well over a year now. The LEI has historically been a good leading indicator of a recession. From Conference Boards’s Justyna Zabinska-La Monica, Senior Manager, Business Cycle Indicators, “The US LEI continued declining in November, with stock prices making virtually the only positive contribution to the index in the month. Housing and labor market indicators weakened in November, reflecting warning areas for the economy. The Leading Credit Index™ and manufacturing new orders were essentially unchanged, pointing to a lack of economic growth momentum in the near term. Despite the economy’s ongoing resilience witnessed in December’s improvement in consumer confidence, the US LEI suggests a downshift of economic activity ahead. As a result, The Conference Board forecasts a short and shallow recession in the first half of 2024.”

Lastly, on the positive side, the recent 0.75% drop in mortgage rates may be bullish for home sales (existing homes and housing starts) in 2024. Stronger home sales and mortgage refinancing activity bode well for consumer spending growth into 2024. Housing affordability is still extremely low but falling mortgage rates have spurred an increase in mortgage applications both for purchases and refinancings. Similarly, falling mortgage rates have boosted homebuilder sentiment, which supports a more positive outlook for housing starts in 2024.
Mortgage refinance applications are up 14.1% from a year ago (see below), the most since February 2021, suggesting that more consumers are tapping into their housing wealth, which could be used for purchases or paying down other debt. This is a tailwind for consumer spending growth, potentially offsetting a downside risk from depleting excess savings and the resumption of student loan payments. While this supports a soft-landing outlook, it also may keep inflation above 2.0%, and Fed policy restrictive for longer.

The Bottom Line
Negative consensus views of the economy and stock market for 2023 never came to fruition. Coming into the year, the Fed was methodically raising rates to rein in inflation, while hoping that the economy would not contract. We witnessed a banking crisis in March that saw the three largest bank failures in US history. Yet, the stock market plowed ahead, led through most of the year by the performance of the “Magnificent 7” mega-cap stocks, until the very end of the year. Even still, only 28% of the companies in the S&P 500 actually outperformed the S&P 500 Index itself, a near record low. You have to go back to 1998 and 1999 right before the technology bubble to find a comparable instance.

The significance of this datapoint should not be overlooked. First off, a healthier-than-expected economy would normally argue for broader market leadership, like we saw in December; however, the extreme outperformance of the Magnificent 7 may be more of a sign of rampant speculation, rather than fundamentals. Second, the last time this occurred in 1999, the average stock in the S&P 500 outperformed the index for 9 of the next 11 years. As such, coming into 2024, we believe that stock portfolios should be broadly diversified to include more exposure to companies not represented in the mega caps, including small-mid caps and non-US companies. In particular, we would be focusing on quality companies demonstrating high levels of profitability, financial strength, and stable/growing dividends.
We see economic growth slowing in the fourth quarter and into the first half of 2024. Slowing growth would not be so bad, but there is a mixed-bag of datapoints with some pointing toward a recession and others pointing toward a continuation of that soft-landing. Two months ago, we were talking about mortgage rates rising to their highest level in the last 20 years; however, with the significant, Fed-induced pullback in interest rates over the last two months, mortgage rates have now fallen 75 bps from their highs, providing a nice potential tailwind to the housing market, the consumer, and the economy. That being said, one has to wonder if that precipitous decline in rates that we have witnessed is an early or leading indication of economic weakness into early 2024.
As noted, at the last Federal Open Market Committee meeting, Chairman Powell indicated for the first time that they could cut rates in the coming months ahead. However, the market instantly “priced-in” double the number of potential rate cuts than the Fed was signaling. We believe that the market should temper expectations for rate cuts should the economy continue with the soft-landing scenario, since that could lead to higher inflation and higher rates. The only scenario where we see the Fed lowering rates over the next 12 months is one where the economy grows slower than expectations or falls into a recession, which would lead to lower inflation numbers. Given their recent comments, one has to wonder whether the Fed knows something that we or the general public don’t.
At Bison, rather than trying to predict the market, we always build our client portfolios based upon our client’s goals and objectives, focused on the long-term and preparing for any market environment. With so many market prognosticators proven wrong at the start of 2023 with bearish forecasts, this year is a proof-point for why we manage client assets in that manner. We seek to implement strategies within our client portfolios that can mitigate the typical volatility of the financial markets and maximize risk-adjusted returns over the long term. This approach has helped us to navigate changing market environments while still meeting the ultimate financial objectives of our clients.
Disclosures
Important Information
Investment Advisory services are provided through Bison Wealth, LLC located at 3550 Lenox Rd NE, Ste 2550 Atlanta, GA 30326 or Bison Advisors, LLC located at 140 Cateechee Trail, Hartwell, GA 30643. Securities offered through Metric Financial, LLC. located at 725 Ponce de Leon Ave. NE Atlanta, GA 30306, member FINRA/SIPC. Bison Wealth, LLC and Metric Financial, LLC are not affiliate entities. More information about Bison Wealth or Bison Advisors and its fees can be found in their respective Form ADV Part 2, which is available upon request by calling 404-841-2224. Bison Wealth and Bison Advisors are independent investment advisers registered under the Investment Advisers Act of 1940, as amended. Registration does not imply a certain level of skill or training.
The statements contained herein are based upon the opinions of Bison Wealth, LLC (“Bison”) and the data available at the time of publication and are subject to change at any time without notice. This communication does not constitute investment advice and is for informational purposes only, is not intended to meet the objectives or suitability requirements of any specific individual or account, and does not provide a guarantee that the investment objective of any model will be met. An investor should assess his/her own investment needs based on his/her own financial circumstances and investment objectives. Neither the information nor any opinions expressed herein should be construed as a solicitation or a recommendation by Bison or its affiliates to buy or sell any securities or investments or hire any specific manager. Bison prepared this Update utilizing information from a variety of sources that it believes to be reliable. It is important to remember that there are risks inherent in any investment and that there is no assurance that any investment, asset class, style or index will provide positive performance over time. Diversification and strategic asset allocation do not guarantee a profit or protect against a loss in a declining markets. Past performance is not a guarantee of future results. All investments are subject to risk, including the loss of principal.
Index definitions: “U.S. Large Cap” represented by the S&P 500 Index. “U.S. Small Cap” represented by the S&P 600 Index. “International” represented by the MSCI Europe, Australasia, Far East (EAFE) Net Return Index. “Emerging” represented by the MSCI Emerging Markets Net Return Index. “U.S. Aggregate” represented by the Bloomberg U.S. Aggregate Bond Index. “Treasuries” represented by the Bloomberg U.S. Treasury Bond Index. “Short Term Bond” represented by the Bloomberg 1-5 year gov/credit Index. “U.S. High Yield” represented by the Bloomberg U.S. Corporate High Yield Index. “Real Estate” represented by the Dow Jones REIT Index. “Gold” represented by the LBMA Gold Price Index. “Bitcoin” represented by the Bitcoin Galaxy Index