

Jun 13, 2024
MAY 2024 Market roundup
Key Observations & Outlook
-
The S&P 500 bounced back to reach new all-time highs in May before closing the month just below those record levels.
-
Softer than expected inflation data and continued strong corporate earnings buoyed market results.
-
Bond prices rose during the month as rates fell, spurred by the benign inflation data.
-
Indications of moderating economic growth confirmed by softening of manufacturing and services survey data.
-
The economy grew at a slower pace than expected, as Gross Domestic Product (GDP), a measure of goods and services produced, increased only 1.6% year over year, short of market expectations of 2.4% growth.
-
While consumer confidence has remained elevated, consumer spending has been modestly trending downwards, after being a resilient source of growth over the last year.
Market Commentary
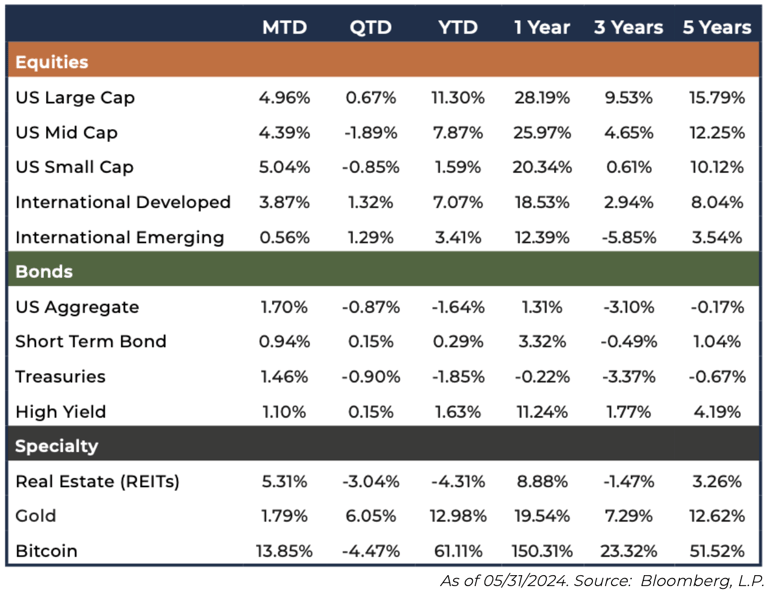
U.S. and global stocks rallied back in May after slumping in April. Amid technology-sector strength and easing Treasury yields, the S&P 500 Index gained nearly 5% in May. The market rebound in May lifted the year-to-date return of the S&P 500 to 11.3%. All S&P 500 sectors advanced in May except energy, which declined minimally.
Interestingly, the technology and utilities sectors were the top performers, gaining 10% and 8%, respectively. Among large caps, the growth style outperformed value (6.7% vs 3.0%, respectively), as Nvidia was the top contributor to the S&P 500 return for May. While Mid-Cap and Small-Cap stocks also performed well in May, returns were more evenly balanced between growth and value. The significant contribution of Nvidia to the cap-weighted benchmark can also be seen in the relatively weaker performance of the equal-weighted S&P 500, up only 2.8% vs the 5.0% return of the cap-weighted index. Non-U.S. developed markets stocks also bounced back but not as strongly as U.S. stocks, while Emerging markets stocks returned less than 1% and lagged developed markets stocks.

Bond returns also rebounded nicely, as April inflation data largely matched market expectations and Treasury yields retreated. The US Aggregate Bond index produced a total return of 1.7% for the month, outpacing Treasuries and High Yield bonds, but the total return year-to-date remains negative at -1.6%. Annual U.S. headline CPI slowed slightly to 3.4% in April, while core inflation eased to 3.6%. With inflation easing modestly, the futures market revisited its late-year Federal Reserve (The Fed) rate-cut expectations. Meanwhile, after nine consecutive months of declines, eurozone core inflation rose in May to 2.9%. The European Central Bank had been signaling that it may cut rates at its June meeting, and despite the recent tick-up in inflation, the ECB followed through on its promise.
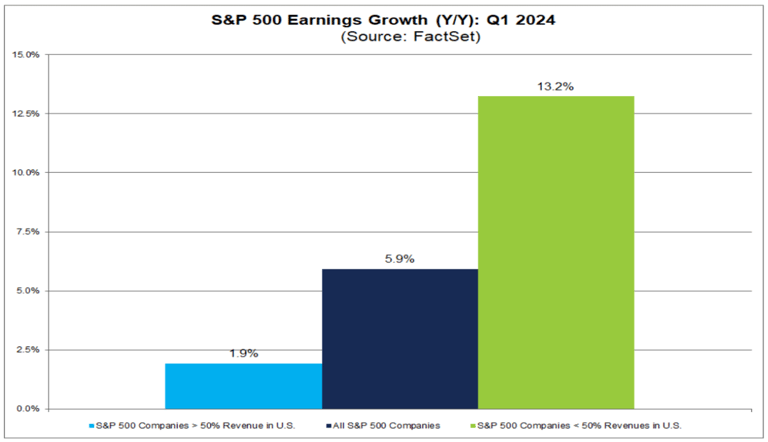
Corporate Earnings Growth Resumes
For the first quarter, most S&P 500 companies have reported earnings results. According to Fact set Earnings Insight, 79% of S&P 500 companies reported a positive earnings surprise and 61% of companies reported upside to revenues versus consensus estimates. The composite results demonstrated a 5.9% growth rate of earnings per share, marking the highest year-over-year reported earnings growth for the S&P 500 since the first quarter of 2022. Of note, however, is the fact that companies with greater than 50% of revenues outside of the U.S. generated earnings growth of 13.2% for the quarter versus those with greater than 50% of revenues in the U.S. showed only a 1.9% growth rate.
Inflation Moderates
Following a few months where it appeared as if the U.S. inflation rate may be accelerating, the April CPI number came in slightly below expectations at 3.4%, and lower than the March inflation data of 3.5%, which had been the highest reading since September of 2023. The bond and stock markets welcomed the news that the inflation rate has stalled. Meanwhile, the “core inflation” rate (which excludes the food and energy components), resumed its downward trend, easing to a 3-year low of 3.6% in April. This latest data may have assuaged concerns about reaccelerating inflation trends for the time being and increased the probability of a Fed rate cut later in the year.

U.S. Economy Providing Mixed Signals
The economy has been providing mixed signals on growth since the recent first quarter GDP release that showed the economy slowing from the strong 4th quarter of last year. More recently, this number was revised downward even further from the originally reported 1.6% annualized growth rate to 1.3%. This revision came largely from a downward revision in consumer spending, reflected in both goods and services spending. A slowdown in consumer spending is a significant change from 2023 where the consumer was a large contributor to strong growth, particularly in the back half of the year.
Most recently, we have seen some additional mixed economic data coming from purchasing managers index surveys. The Institute of Supply Chain Management (ISM) survey showing a rebound in the Services sector of the economy to the highest reading in the last nine months, while the same ISM Manufacturing survey showing the second consecutive month of contraction in that segment of the economy, along with a decline in the Manufacturing New Orders sub-component. However, the S&P Global US Composite PMI rose to 54.5 in May 2024, up sharply from 51.3 in April. As reported by S&P Global, this marks the strongest increase in business activity since April 2022, as growth accelerated in both manufacturing (PMI at 51.3 vs 50.3 in April) and services (PMI at 54.8 vs 51.3). Companies boosted output due to a renewed rise in new orders, following a slight decline in April, and new export business saw a marginal increase.

The Bottom Line
The stock and bond markets both experienced a welcome bounce in the month of May, following the sell off in April. As for the equity markets, however, we are starting to see the broadening of market returns subside as the market indices, such as the S&P Equal-Weighted, Mid-Caps, and Small-Caps continue to lag behind the S&P 500 Index year-to-date. To this point, the S&P 500 Top Ten Index is up 19.5% year-to-date. Most recently, this concentration of returns has come from Nvidia, which itself has accounted for 36% of the S&P 500 Index’s return this year. While we are seeing a resurgence in corporate profit growth that should help propel returns from a wider group of companies across the market cap and style spectrum, thus far, this has not materialized as anticipated.
The financial markets and the Fed seem to be digesting the recent mixed-signals for the economy and inflation. The most recent inflation data is a step in the right direction but still well off from the Fed’s 2.0% target inflation rate. The recent downward revision to 1st quarter GDP and modestly slower consumer spending trends suggest that growth is moderating a bit, but there remains a mixture of both positive and negative economic signals over the last couple of months that make it less clear as to whether this slowing will persist or if it is just indicative of choppier growth ahead for the remainder of the year.
Nonetheless, this recent inflation and economic data does modestly enhance the probability of a rate cut in 2024. The Fed is expected to make no change in its key rate over the next few meetings, but investors will be looking for direction from Jerome Powell in his press conferences as to how long the current “higher-for-longer” inflation could last and what additional data may be needed for the Fed to make its first rate cut.
While emerging market returns cooled in May, the non-U.S. developed markets performed well, where areas such as Europe are seeing a favorable backdrop of modestly accelerating economic growth with lower rates of inflation, leading to the recent decision by the European Central Bank to cut its key interest rate from 4.00% to 3.75%, its first rate cut since 2019. The Bank’s move marks a divergence from our U.S. Federal Reserve, which has been maintaining rates in the face of more stubborn inflation.
Since the October lows, investors have priced a lot of good news into the stock market, lifting it to new highs, but also to elevated valuations. Following the April market setback, stock market volatility has fallen abruptly over the last several weeks, typically a welcome sign for investors. However, investors should expect the unexpected and be prepared for the typical market volatility associated with uncertainty around election years and geo-political events. With respect to constructing portfolios at Bison, we believe in preparing portfolios to weather the volatility storms, rather than trying to predict the market. As a result, we continue to construct portfolios with strategies that can offer lower volatility and uncorrelated risks that are associated with traditional stock and bond portfolios.
Disclosures
Important Information
Investment Advisory services are provided through Bison Wealth, LLC located at 3550 Lenox Rd NE, Ste 2550 Atlanta, GA 30326 or Bison Advisors, LLC located at 140 Cateechee Trail, Hartwell, GA 30643. Securities offered through Metric Financial, LLC. located at 725 Ponce de Leon Ave. NE Atlanta, GA 30306, member FINRA/SIPC. Bison Wealth, LLC and Metric Financial, LLC are not affiliate entities. More information about Bison Wealth or Bison Advisors and its fees can be found in their respective Form ADV Part 2, which is available upon request by calling 404-841-2224. Bison Wealth and Bison Advisors are independent investment advisers registered under the Investment Advisers Act of 1940, as amended. Registration does not imply a certain level of skill or training.
The statements contained herein are based upon the opinions of Bison Wealth, LLC (“Bison”) and the data available at the time of publication and are subject to change at any time without notice. This communication does not constitute investment advice and is for informational purposes only, is not intended to meet the objectives or suitability requirements of any specific individual or account, and does not provide a guarantee that the investment objective of any model will be met. An investor should assess his/her own investment needs based on his/her own financial circumstances and investment objectives. Neither the information nor any opinions expressed herein should be construed as a solicitation or a recommendation by Bison or its affiliates to buy or sell any securities or investments or hire any specific manager. Bison prepared this Update utilizing information from a variety of sources that it believes to be reliable. It is important to remember that there are risks inherent in any investment and that there is no assurance that any investment, asset class, style or index will provide positive performance over time. Diversification and strategic asset allocation do not guarantee a profit or protect against a loss in a declining markets. Past performance is not a guarantee of future results. All investments are subject to risk, including the loss of principal.
Certain information contained herein constitutes “forward-looking statements,” which can be identified by the use of forward-looking terminology such as “may,” “will,” “should,” “expect,” “anticipate,” “project,” “estimate,” “intend,” “continue,” or “believe,” or the negatives thereof or other variations thereon or comparable terminology. Due to various risks and uncertainties, actual events, results or actual performance may differ materially from those reflected or contemplated in such forward-looking statements. Nothing contained herein may be relied upon as a guarantee, promise, assurance or a representation as to the future.”
Index definitions: “U.S. Large Cap” represented by the S&P 500 Index. “U.S. Small Cap” represented by the S&P 600 Index. “International” represented by the MSCI Europe, Australasia, Far East (EAFE) Net Return Index. “Emerging” represented by the MSCI Emerging Markets Net Return Index. “U.S. Aggregate” represented by the Bloomberg U.S. Aggregate Bond Index. “Treasuries” represented by the Bloomberg U.S. Treasury Bond Index. “Short Term Bond” represented by the Bloomberg 1-5 year gov/credit Index. “U.S. High Yield” represented by the Bloomberg U.S. Corporate High Yield Index. “Real Estate” represented by the Dow Jones REIT Index. “Gold” represented by the LBMA Gold Price Index. “Bitcoin” represented by the Bitcoin Galaxy Index