

June 2023 Commentary
Jun 07, 2023
Market Recap
US Large Cap stocks squeaked out positive gains for the month, buoyed by the performance of a few of the largest capitalization companies such as Apple and Microsoft, which have a combined weight of 13% of the S&P 500 index. In a repeat of last month, US Mid and Small Cap companies posted negative returns, reflecting the continued narrow market advance over the past couple of months. In the fixed-income markets, bonds posted negative returns as interest rates rose during the month, led by the short end of the yield curve, as expectations for more Fed hikes outweighed concerns over the economy and the banking sector and uncertainty surrounding raising the debt ceiling. Meanwhile, some weaker than expected economic data coming out of Europe and other parts of the globe caused international stock markets to pull back during the month.

The following is a summary of our key observations over the past month and the impact on our outlook:
- The overarching theme for the stock market in 2023 has been the mean reversion in mega cap stocks, which underperformed in 2022. These stocks have been significantly outperforming the broader market of stocks, causing some to question the sustainability of the recent move.
- Mixed economic data has left the market wondering whether or not the Fed would raise rates again at the June policy meeting.
- While there were some positive economic indications, there were several retailers that delivered very disappointing earnings news and outlooks, reflecting that the average consumer may be under pressure.
- With a resolution to the debt ceiling issue, new issuance of Treasury securities to the tune of $1 trillion in value will take center stage along with how that impacts the Fed’s balance sheet.
Mega-Cap Stocks Outperform the Broader Market
The overarching theme for the stock market in 2023 is the mean reversion in mega-cap stocks that underperformed in 2022. First, the nature of cap-weighted indices like the Nasdaq 100 and S&P 500 means that a small number of stocks can inordinately impact the performance of the index for the better or worse. In a given year, if a few of the largest stocks post big returns, they can contribute most of the gains, as has been the case this year. The leadership from mega-caps is not a problem if other stocks are rallying, but not as much. Issues arise typically when mega-caps are the only stocks going up and driving all the returns.
Over the past two months, the mega-cap trade has grown even more popular, to the detriment of the broad market. The S&P 500 hit a nine month high on Tuesday, but only a small number of stocks were hitting new nine month highs. By some measures, the narrowness has reached historic levels. The five largest stocks in the S&P 500 account for 24.7% of the index, a record high dating back to 1972. Year-to-date, only 24.5% of stocks have outperformed the index. If it holds through the end of the year, it would be the lowest percentage of stocks outperforming the index on record, with data starting in 1973 (see chart below).

This is holding true over a shorter period as well with the percentage of S&P 500 stocks that have outperformed the index on a rolling three month (63 trading day) basis, which roughly corresponds to the start of the regional banking crisis. The current reading shows that only 20.3% of stocks in the index are outperforming the index as a whole, a record low dating back to 1972.
Usually, at such extremes, something tends to give, but it does not necessarily mean disaster for the stock market. Either the broader market needs to play catch up with the largest stocks or the largest stocks and broader market could struggle moving forward. Looking at studies of market returns after periods of extremely narrow leadership, the S&P 500 has seen mixed results, with average gains below its long term norms one year later. The end of periods of relative strength by a small group of large cap stocks has tended to weigh on cap weighted index returns in forward periods. History suggests the market will need a wide broadening to avoid weak returns over the coming year.
The end of narrow leadership has been bullish for small caps relative to large caps, on average. One year following periods of narrow leadership driving stock returns, the Russell 2000 has outperformed the Russell 1000 in every occurrence, with the ratio up a median of 7.6%.

The Economy, Fed Policy, and Inflation
Early in May, the market was betting that the quarter point increase executed at the May 3 Fed meeting would be the last of the cycle, an idea supported by another regional bank failure (First Republic) and Jay Powell’s post-meeting comments hinting at a policy pause. After a brief bout of optimism for the Fed to pause, brought on by an unexpected climb in job openings and a mostly tame CPI report, economic releases started picking up steam, sending yields higher. Solid prints on consumer spending and housing quelled near-term recession fears, while a hotter than expected reading on core PCE confirmed that inflation remained stickier than policymakers would like. With the economy not giving in to recession just yet and inflation still well above target, market participants are coming to the realization that any hoped for rate cuts in the second half of 2023 will probably not materialize.
Retail Stocks Reflecting Consumer Weakness
For a while, we have been suggesting that the average consumer was stretched thin with personal savings drained and record levels of consumer debt. There has not been a change to this thesis as April US Retail sales continued to slow.

Furthermore, several high-profile bellwether retail companies reported disappointing earnings and outlooks, including Ulta Beauty, Advance Auto Parts, and Dollar General. Each of these stocks posted 20%+ declines on their reported earnings. The Dollar General CEO framed the developing reality of the weakening consumer as follows: “We continue to see signs of increasing financial strain.”
A healthy bull market is typically led by the consumer. Comparing the performance of retail stocks versus the S&P 500, we can see that retail stocks are not only lagging the S&P, but also the Russell 2000 small cap index year to date.

Fed Balance Sheet: Quantitative Tightening (QT) versus Quantitative Easing (QE)
Some market participants have been overly focused on the debt ceiling itself as the primary issue facing our economy, but as we have surmised, it was pretty much a foregone conclusion that the debt ceiling would be raised. It was never a matter of if, but when. More important than the debt ceiling are the implications of what happens with the Fed balance sheet and financial system liquidity when the Treasury begins the issuance of $1 trillion in US debt obligation. Up to this point over the last several months, the Treasury has been drawing down its cash balance from the Treasury General Account, without new debt issuance. This has been a net positive from a financial liquidity perspective because this has acted like fiscal stimulus, pumping liquidity in the financial markets. However, if the prevailing relationship holds true, this new deluge of Treasury bond issuance, post raising the debt ceiling, will have the exact opposite effect of draining liquidity from the financial system. This is quantitative tightening of monetary policy, which has historically been a headwind for stocks.
The last time we faced a major debt ceiling crisis, similar to the rhetoric of the last few months was in 2011, after which S&P famously downgraded the US credit rating. In the wake of ultimately resolving that crisis, the Fed balance sheet assets begin to decline immediately. Stocks subsequently had an 18% correction from peak to trough.
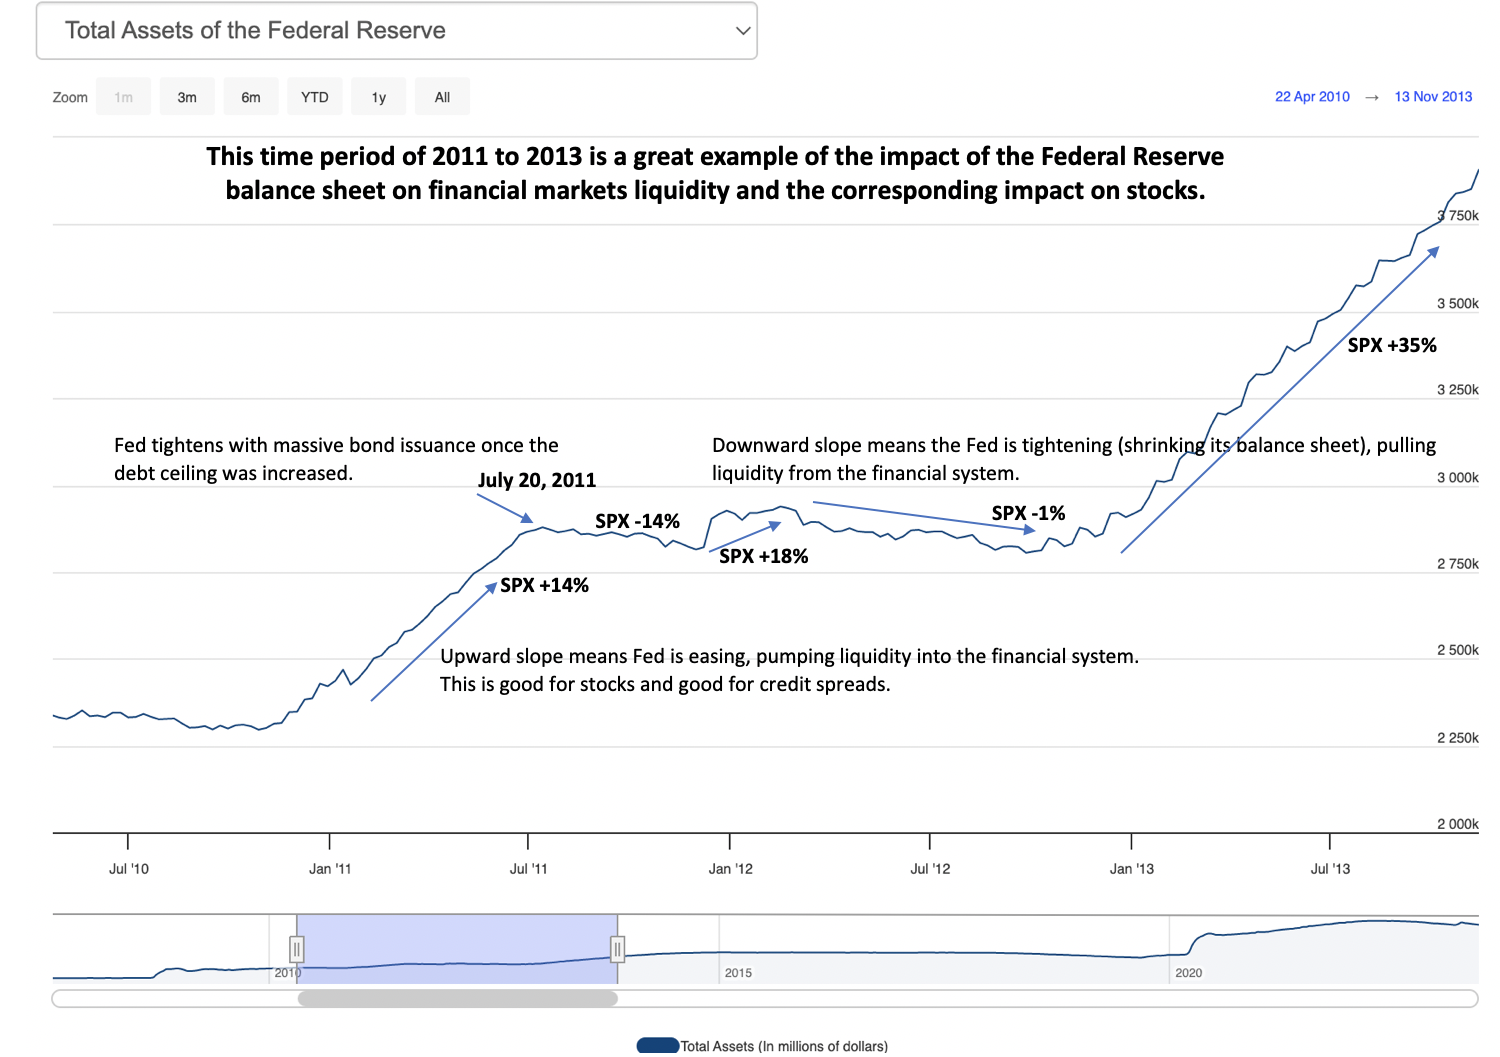
Fast forwarding to today, we can clearly see a relationship between the performance of the stock market and whether the Fed is growing or shrinking its balance sheet: quantitative easing versus quantitative tightening. During periods of tightening, the stock market has struggled, and not surprisingly, during periods of easing or growing the Fed balance sheet, stocks typically post above average returns.

The Bottom Line
Recent economic data points have given bulls some ammunition to power the stock market higher in the face of economic reality, slowing money supply growth (-9% yoy), continued tightening credit conditions with banks, declining discretionary consumption capacity, and the potential for significant quantitative tightening with the issuance of new treasury bonds to finance government operations. To start the month of June, we have seen a resurgence in some areas of the market that have lagged more recently which include small caps, financials, and high beta/lower quality companies. Furthermore, volatility has fallen to levels that we have not seen since 2021, which could indicate either market participants are becoming complacent and not pricing in the aforementioned risks or that there is the potential for this market rally to broaden in the near term.
We have discussed in previous commentaries that it can take an extended period of time for bear markets to fully play out, and that powerful rallies can occur in the midst of a broader, full cycle decline. This year, we have witnessed a tremendous rally in the Nasdaq from its end of 2022 lows, up roughly 27%, fueled by overly bearish sentiment and the mega-cap tech stocks. However, we can also point to the period between 2000 and 2002 and the bear market that was sparked by the technology/internet bubble. During that period, the Nasdaq Index experienced 11 rallies of more than 10% with 4 of those moves between 28% and 49%. As we manage our portfolios, it is important that we keep that broader perspective that includes an historical context and to see the entire forest that exists beyond the trees. No one can say with 100% certainty how the current situation will play itself out, but we maintain a more cautious approach with equities at the low end of our allocation range and further conservative positioning within our equity sleeve. Furthermore, we maintain exposures to alternative asset classes, such as gold and private credit, that tend to be less correlated with the stock market, and in some cases, perform well in times of market stress.
Disclosures
Important Information
Investment Advisory services are provided through Bison Wealth, LLC located at 3550 Lenox Road NE Suite 2550 Atlanta, GA 30326. Securities are offered through Metric Financial, LLC. located at 725 Ponce de Leon Ave. NE Atlanta, GA 30306, member FINRA and SIPC. Bison Wealth is not affiliated with Metric Financial, LLC., More information about the firm and its fees can be found in its Form ADV Part 2, which is available upon request by calling 404-841-2224. Bison Wealth is an independent investment adviser registered under the Investment Advisers Act of 1940, as amended. Registration does not imply a certain level of skill or training.
The statements contained herein are based upon the opinions of Bison Wealth, LLC (“Bison”) and the data available at the time of publication and are subject to change at any time without notice. This communication does not constitute investment advice and is for informational purposes only, is not intended to meet the objectives or suitability requirements of any specific individual or account, and does not provide a guarantee that the investment objective of any model will be met. An investor should assess his/ her own investment needs based on his/her own financial circumstances and investment objectives. Neither the information nor any opinions expressed herein should be construed as a solicitation or a recommendation by Bison or its affiliates to buy or sell any securities or investments or hire any specific manager. Bison prepared this Update utilizing information from a variety of sources that it believes to be reliable. It is important to remember that there are risks inherent in any investment and that there is no assurance that any investment, asset class, style or index will provide positive performance over time. Diversification and strategic asset allocation do not guarantee a profit or protect against a loss in a declining markets. Past performance is not a guarantee of future results. All investments are subject to risk, including the loss of principal.
Index definitions: “U.S. Large Cap” represented by the S&P 500 Index. “U.S. Small Cap” represented by the S&P 600 Index. “International” represented by the MSCI Europe, Australasia, Far East (EAFE) Net Return Index. “Emerging” represented by the MSCI Emerging Markets Net Return Index. “U.S. Aggregate” represented by the Bloomberg U.S. Aggregate Bond Index. “Treasuries” represented by the Bloomberg U.S. Treasury Bond Index. “Short Term Bond” represented by the Bloomberg 1-5 year gov/credit Index. “U.S. High Yield” represented by the Bloomberg U.S. Corporate High Yield Index. “Real Estate” represented by the Dow Jones REIT Index. “Gold” represented by the LBMA Gold Price Index. “Bitcoin” represented by the Bitcoin Galaxy Index.
- June 2026 (2)
- April 2026 (1)
- March 2026 (1)
- February 2026 (1)
- January 2026 (1)
- December 2025 (3)
- September 2025 (1)
- August 2025 (1)
- July 2025 (1)
- June 2025 (1)
- May 2025 (1)
- April 2025 (1)
- March 2025 (2)
- January 2025 (5)
- August 2024 (8)
- July 2024 (1)
- June 2024 (1)
- May 2024 (1)
- April 2024 (1)
- March 2024 (1)
- February 2024 (2)
- January 2024 (3)
- December 2023 (1)
- November 2023 (1)
- October 2023 (1)
- September 2023 (1)
- August 2023 (1)
- July 2023 (1)
- June 2023 (1)
- May 2023 (1)
- April 2023 (1)
- March 2023 (1)
- February 2023 (1)
- January 2023 (1)
- December 2022 (1)
- November 2022 (1)
- October 2022 (1)
- September 2022 (1)
- August 2022 (1)
- July 2022 (1)
- May 2022 (3)